
One of the reasons I’ve read through David Anderson’s Kanban book is the need for metrics. I was inspired by Lean Enterprise to become more metric-driven and make measurement more of the foundation of my management approach. Anderson did not disappoint. He devotes a whole chapter to which metrics to track on an initial Kanban initiative.
Cumulative Flow
Kanban is focused on limiting work in progress to create flow, so it’s only natural to create a cumulative flow diagram. This should tell us a lot about the nature of flow in the project. Here is one from a recent release from YouTrack that I only looked at today:

You can see that we had a lot in Ready for QA and nothing flowing to Done. But then at the end of the release, many of them drop off. Did they go to the next release? Why? Why weren’t they finished? The Developing features were staying constant, so it looks like that isn’t a problem. The analysis is bunched up at the start of the release, but isn’t occurring toward the end of the release. Is this a problem? There are so many actionable ideas that are coming out of viewing this chart. For now on, this chart will be at the forefront of any metrics my teams provide.
Lead Time
In a Kanban system, lead time is important because it is the basis of actions in the system. If the lead time is
20 days, you’re asking your stakeholders the question, “What X items will you want 20 days from now?” Also, when determining whether something needs to be rushed through a system, we have to know lead time. In other words, if a stakeholder needs something in 30 days, is it possible? Without a lead time metric, that’s not known.
Anderson stresses the importance of lead time distribution over mean lead time, because it will help the team understand the certainty with which commitments can be made. I wasn’t able to generate lead time from YouTrack, but I created a mock one in Excel fairly easily:

This tells us that we can easily promise a lead time of 10 days on the project. Many items will go much faster than that.
Throughput
Throughput is the measurement of how many items go through the system over a fixed period of time, usually months. Ideally throughput should be high. Here is the throughput on one of my projects from the last part of
2014:
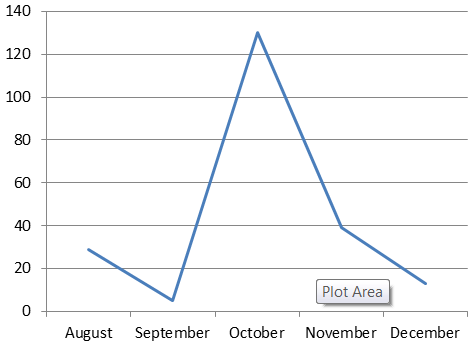
This tells us that there was a huge spike of productivity in October. Why was that? To be honest, it was because there was an important deadline to meet and I worked overtime on the project to get it done. Another observation from this data is that throughput is by no means consistent. Why is this? It can probably be seen in the cumulative flow diagram above if we view it for all months.
Continuous improvement goals should be to increase throughput.
Initial Quality
We want to make sure we don’t motivate the team to speed up without regard for quality issues they are creating. So we need quality to be one of our core metrics. Anderson talks about the metric being defects per feature, but I disagree. I want to just track straight defects that are found by customers:

Wow, October was busy! This makes me wonder whether all that productivity was worth it. November and December trended downward (but there was vacation in those months as well).
A good metric is one that initiates action, and, as you can see here, these metrics are a great start to seeing the health of a project and ideas for improvement. They will be the basis of project management going forward.